Start Slideshow


 OMA Roadmap 2050Architects aren't typically known for their <a href="http://inhabitat.com/2010/05/12/kerry-lieberman-to-unveil-climate-bill-today/" target="_blank">policy planning and work on climate change</a>, but Rem Koolhaas's <a href="http://www.inhabitat.com/2009/01/15/zeekracht-plans-by-oma/" target="_blank">OMA</a> (Office of Metropolitan Architecture) is a bit outside of the box. They recently unveiled a policy report on how Europe can drastically reduce its carbon emissions by <b>80%</b> before 2050 rolls around. Their plan, developed in part with the <a href="http://www3.imperial.ac.uk/" target="_blank">Imperial College London</a>, <a href="http://www.kema.com/Default.aspx" target="_blank">Kema</a>, <a href="http://www.mckinsey.com/" target="_blank">Mckinsey & Company</a>, and <a href="http://www.oef.com/" target="_blank">Oxford economics</a>, proposes an EU-wide decarbonized grid and essentially a realignment of the boundary lines according to <a href="../energy/" target="_blank">renewable energy resources</a>. The Roadmap 2050, which was commissioned by the European Climate Foundation, actually provides a practical guide to replacing fossil fuels with renewable energy, but it only works if the whole of Europe works together.1
 OMA Roadmap 2050The main principle behind OMA's Roadmap is the efficient utilization of all renewable energy resources from the region. Solar from the south; wind, hydro and tidal form the North; and biomass in the East.2
 OMA Roadmap 2050The Roadmap proposes a practical guide to replacing fossil fuels with renewable energy through the implementation of policy and advancing technology, so by 2050, the region can reduce 80% or more of its carbon emissions.3
 OMA Roadmap 2050Visualizing the power grid as a subway map helps clarify where all the power is coming and how it is connected. Light blue is hydro, dark blue is wind, pink is geothermal, orange is nuclear, yellow is solar and green is biomass.4
 OMA Roadmap 2050Part of OMA's guide envisions Europe with new boundary lines drawn according to the major energy resource. Central Europe including most of Germany becomes Enhanced Geothermalia.5
 OMA Roadmap 2050Hydropia, which is the Scandanavian countries, has a large resource of hydro power from its rivers.6
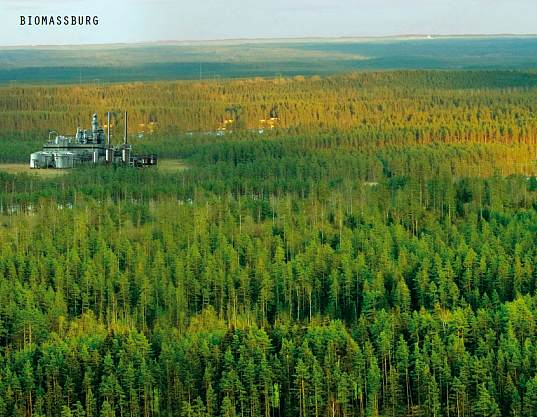
 OMA Roadmap 2050Eastern Mediterranean Europe, which is largely populated with forests, could easily churn out energy from biomass.7
 OMA Roadmap 2050Ireland and Eastern Britain has a powerful tidal source that could be tapped to become the Tidal States.8
 OMA Roadmap 2050Meanwhile the North Sea region would harness the strong offshore winds and become the Isles of Wind.9
 OMA Roadmap 2050Then down South along the Mediterranean, where the solar resource is strong, the sun would be utilized for solar thermal and photovoltaics to become Solaria.10
 OMA Roadmap 2050During the winter, the winds and tides are stronger so more power would be generated in the north and exported South when the sun is less strong. During the summer, when the sun is blazing down South, they can export solar energy to the calmer North.11
 OMA Roadmap 2050Renewable energy plants would certainly not be limited to just one specific area, as all areas have multiple resources. This map shows which regions have what renewable energy sources. It should be noted that nuclear energy has also been included in the Roadmap.12
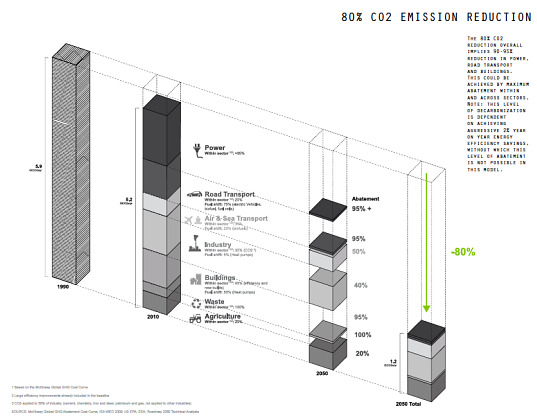
 OMA Roadmap 2050Drastic reductions in energy use and carbon emissions would mostly occur in the area of power generation, road transportation, the building industry and waste.13
 OMA Roadmap 2050Here are the projected energy demands for each region by 2050.14


